




Andrew Pyle
September 12, 2025


Tripping over paper
They say timing is everything. Just as I was finishing up last week’s diatribe on the situation facing long-term global bonds, a much weaker-than-expected read on U.S. payrolls came along, sparking a massive rally across the curve — especially at the back end. After testing 5% on the Wednesday before payrolls, the 30-year yield closed at 4.77% on Friday. Add in an August producer price index (PPI) headline that also came in below consensus, and then a much larger-than-forecast annual benchmark revision to payrolls over the last year, and the market seemingly forgot about all the worries that existed just a week ago.
As most of you know, I tend to focus on the bigger picture in our weekly newsletters, and I will submit that the essence of last Friday’s commentary remains unchanged. The threat of a continued upward trend in long yields is still in place and this latest retracement may simply be a short-term oasis. We left off last week at what implications there may be for equities if in fact yields keep rising. There are four main channels where higher long-term yields can negatively influence the direction of stocks.
One is the discount-rate effect. Because a stock’s price is a present value estimate of future earnings, calculated by discounting to the prevailing discount rate or yield, when long yields move higher, this will result in a lower present value calculation. As such, stocks that are more growth-oriented and have a higher sensitivity to long rates will often see their valuations pressured. We sometimes refer to these as long-duration equities. Examples include technology stocks.
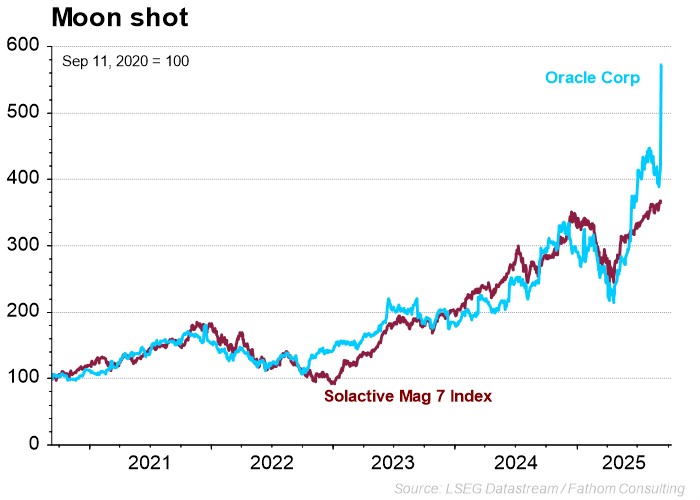
Given the main engine of growth for U.S. stocks has been mega-cap tech, it stands to reason that this sector could be the most vulnerable in the event that the long end of the curve sells off.
Another reason equities can be adversely affected by rising long-term yields is via the economic channel. As yields rise, borrowing costs for businesses and consumers also go up. Companies looking to finance acquisitions or capital expenditures via debt will find it more expensive. If there is sufficient cash flow generation, this is less of a problem, but right now, it is mainly the case for large-cap tech firms. For some perspective, the total trailing cash flow from operations for the S&P 500 was just over $2.5 trillion. Of that, 13 non-financial companies in the index had generated close to half of that number.
For other companies that are facing higher costs from tariffs and wages and do not have the cash flow growth to fund business investment, higher lending rates are going to take another bite out of net income. On the one hand, this pressure on earnings will be reflected in stock valuation. On the other hand, if companies have to shed employees to put a lid on overall costs, this has a second-order effect: lower employment, lower consumer spending, a weaker economy, and less positive fundamentals for future earnings.
At the household level, rising mortgage rates can stifle housing demand and residential construction, which again feed through to aggregate economic growth. While the so-called “wealth effect” has been alive and well with respect to individual portfolios increasing, if there is a break in residential housing wealth, this could easily outweigh the influence from a rising stock market.
Yet another channel where long yields can impact equity valuations is through what we call equity risk premium compression. Just as there is a term premium that investors require to hold longer-term bonds versus shorter ones, the same applies to being compensated for taking medium or high risk in equities, compared to lower risk in government bonds. At the heart of this channel is the concept of risk-adjusted return. Yes, we historically expect a higher total return on stocks versus bonds, but that higher return comes with a price tag of higher relative volatility. In other words, you have to work for that bigger return.
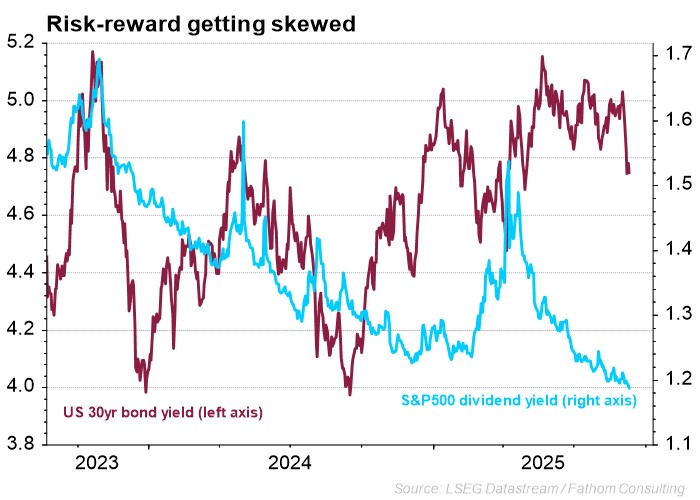
Now, when bond yields are low, we do not mind the extra work because the relative payoff is decent. When those yields are high, however, the relative attractiveness of stocks begins to fade. Historically, when long-term U.S. bond yields have reached 5% and above, the appeal of equities indeed starts to slip. In the above chart, I compare the U.S. 30-year yield to the dividend yield of the S&P 500. As you can see, the gap between the two before this recent bond rally is now approaching 4%. Enthusiasm over earnings, the prospect for near-term rate cuts, and simply the existence of FOMO (fear of missing out) is allowing for this gap to stay wide, but the slightest smudge on this portrait of equity bliss could see a rush for the exit.
As we have discussed with clients, September and October can be problematic months for investors, and we tend to expect higher volatility and risk asset drawdowns. This does not happen every year, but if you were to ask me if 2025 was a likely candidate for a haircut, I would have to say that the combination of high current valuations and, well, Trump, would suggest the odds are pretty good. Note, the arrival of seasonal volatility patterns does not always come with increased bond volatility and yields, but when it does, the impact can be magnified.
Recent examples include October 2023, when the U.S. 30-year yield extended above 5%. The subsequent pullback in the S&P 500 was not massive, but it was still a bit of a sting. Of course, 1987 still stands out in the memories of investors who have been at it a little longer. Remember Black Monday. The chart below illustrates four episodes where we had a meaningful lift in the long bond yield and a negative reaction in stocks.
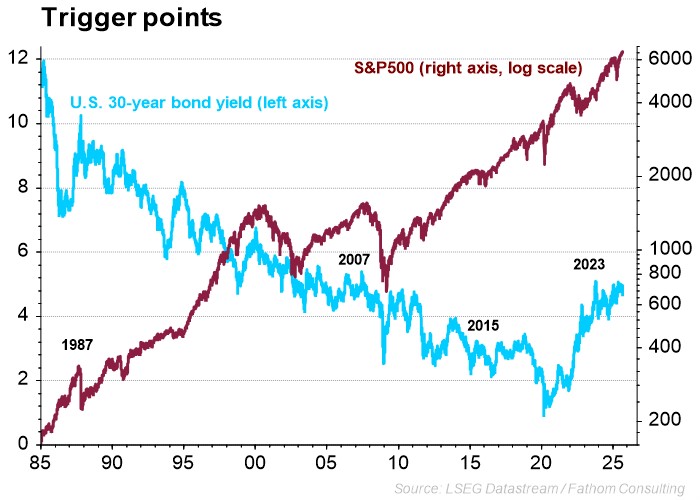
The 1987, 2007, and 2015 examples also satisfy a test that we ran for bond sell-off triggers. Specifically, I am testing for situations where there is a significant 3-month increase in the 30-year yield, triggering more than a 5% retracement in the S&P 500 in the next month, over two months, and over three months. For October 1987, we saw greater than a 1% rise in the 30-year bond yield, resulting in a negative equity response that remained in place for three months. In June 2007, there had been a 0.6% rise in the bond yield, triggering more than a 5% pullback in the S&P 500. This initial trigger did not result in a drop in stocks over three months, but it did kick off the credit crunch and great financial crisis, which saw a lot more pain for stocks through to 2009. Finally, in June 2015, there had been a cumulative back-up in the long bond yield of close to 1%. While it did not immediately cause the S&P 500 to slump, it ultimately resulted in a correction that lasted into early 2016.
What is interesting this year is that we saw a substantial rise in yields from early April to the third week of May, when the 30-year broke 5%; though we did not get a negative equity response. The simple answer is that Trump had already broken equities in April, and by the time yields spiked, investors were calming down with respect to tariffs and where the economy was headed. Now that the 30-year is trading below 4.7%, if anything sparks a back up past the 5.2% highs of 2023, then it could very well turn out to be a trigger — not necessarily in the fall, but into the early part of the year.
Can this equity rally be tripped up by a piece of paper? Well, since 1987, you can no longer buy U.S. treasuries in paper form, but could it be tripped up by a digital signature? Possibly. For this reason, we are not only maintaining a shorter duration in the bond portfolio, but also preferring lower-duration equities as well, with a good dose of cash.
On behalf of the Pyle Wealth Advisory team, have a wonderful weekend.
Andrew Pyle
Related posts
Andrew Pyle
November 06, 2026
Black and Blue
A blue wave, a record rally, then a bruising selloff. The wave giveth, and the wave taketh away.
Read moreAndrew Pyle
October 30, 2026
The Road Less Hiked
The road less hiked made all the difference this week, with the BoC opting to move while the Fed preferred to linger at the fork.
Read more