




Andrew Pyle
November 06, 2026


Black and Blue
Following Tuesday’s US mid-term elections, I was hoping that I could finally free up some time to get back to the guitar. Democrats swept the US midterms, and at the time of writing, they had taken 54 Senate seats to the Republicans' 44, with Alaska and Mississippi still too close to call, and on track for their largest House majority since 2008. Markets were indeed jubilant after what some called a “blue tsunami”. What could go wrong? Then again, I also thought I would be over this darn cold after a week and a half of exhausting Kleenex supplies. Maybe the tsunami label was a jinx. After all, waves can be nice gentle things that we can bob around on, while tsunamis create destruction in their wake. Ally and I were adamant that whatever the results were, there was little reason to make drastic changes to the portfolio. While we could possibly extract some positive implications from a Democratic sweep and an increase in the number of Democratic governorships, the January 3rd swearing-in is a long way away and anything can happen in the interim. I just didn’t think the wobbles would start the next day.
On Wednesday the Dow gained about 1,570 points, or 3%, its biggest post-midterm one-day gain since 1982, and the S&P 500 added 1.6% to close at 7,689. Brent crude fell nearly 9%. On Thursday it all unwound. By the close, the Dow was down roughly 3.4%, the S&P 500 about 4.4% and the Nasdaq about 5.5%, which pushed the index into a technical correction (more than 10% below its record from last month). To put the unwind of enthusiasm in context, the S&P 500 ended 2.8% lower than its close on election day and is at its lowest since late July. The biggest shock though was seeing the PHLX Semiconductor Sector Index (SOX) drop more than 12% on Thursday, as you can see in the chart below.
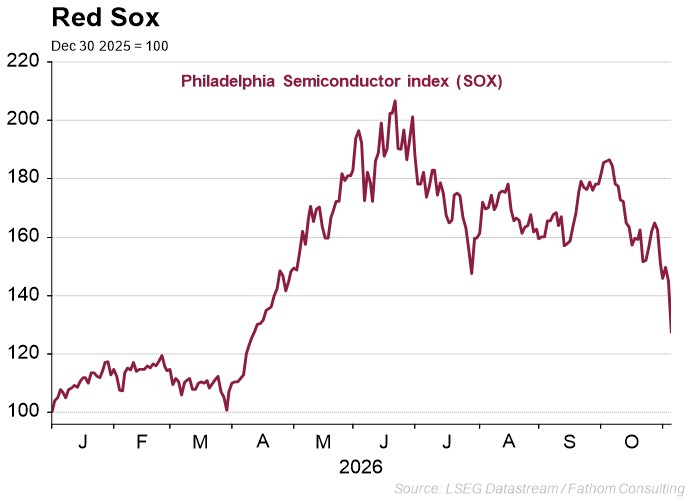
Why it reversed: the AI trade meets a Democratic Congress
The trigger was technology and really was a matter of two worries colliding. Politically, many newly empowered Democrats ran campaigns critical of AI data centers, and investors began to price a slower buildout. We have been among those skeptical of claims that AI investment would generate a quick return given limited end-user demand, but as long as supply-side conditions remained supportive, the sector could continue to grind higher. Even borrowing costs have eased, with 10-year US yields coming from around 5.30% last month to close to 4.80% this week. This relief was not enough to counter a public and political blowback.
History does, however, paint a better backdrop to Thursday’s meltdown, even if we were to see continued pressure in the coming days. The S&P 500 was higher one year after every midterm from 1946 to 2022, averaging a gain of roughly 15% against about 9% for all 12-month periods since 1946. Stretch the record back to 1874 and it is less tidy but still strong: 32 of 38 midterms were followed by gains, averaging 14%. Timing matters though. The first month after a midterm averages just 0.5% and is positive only 55% of the time. The bigger gains arrive later, about 6% at three months and 10% at six. The first days after a vote are rarely the story.
The political arrangement matters less than most people assume. Across 14 midterms that left a Republican president facing a divided government, the market was higher 12 months later 93% of the time. Landslides have not hurt either: midterms in which the president's party lost 40 or more House seats have produced returns similar to those with smaller losses. A Goldman Sachs study published in 2018 found that when both chambers flip, stocks have tended to stumble in the first month (down more than 1% on average) before recovering to about 17% a year out, although the sample is small. Wednesday's rally briefly broke that pattern. Thursday's selloff restored it.
The closest precedents are mixed, and they carry a useful lesson about the cycle.
• 1958: Democrats gained roughly 50 House seats. The S&P 500 rose 11.3% over the following year.
• 1974: The Watergate wave added about 48 to 49 House seats, depending on how the count is made. The S&P gained 21.1%
over the next year, coming off a brutal bear market.
• 2006: Democrats took both chambers, adding 30 House seats. The S&P gained 6.7% over the next 12 months, but that window closed just after the October 2007 peak and before the 2008 crash. Democrats added another 26 House seats in 2008, in the middle of the financial crisis.
• 2018: Democrats flipped the House by about 40 seats while Republicans held the Senate. The S&P gained 12% over the next 12 months.
The pattern is that the size of the majority did not decide the market's path. The starting valuation, the rate cycle and the economy did. Sector leadership did shift. After 2006, homebuilders led the market and biotech lagged. That matters now, because the leadership being questioned is the AI trade that carried the market into the election. And like a famous line from a previous Democratic election victory stated, “it’s the economy, stupid!”, the economy does remain the primary driver of stock market returns, even if elections shape the narrative.
A Democratic Congress can help at the margin. Investors are betting it keeps a lid on government borrowing, which helped bonds on Wednesday, and falling oil takes pressure off inflation. But oil rebounded on Thursday, and that day's bond rally looked more like a flight from stocks than a vote of confidence. Beneath the S&P 500, sector leadership is shifting. Historically, since 1990, cyclical sectors and high-yield bonds have led in seven of the eight six-month windows after a midterm. Here is how Wednesday's first read looked, before Thursday's tech selloff:
Sector | Wednesday Read | What Drove It |
Healthcare | Positive | Hospitals and insurers rallied on hopes of restored ACA subsidies and delayed Medicaid cuts; some of this was already priced in. Drug pricing is a risk for pharma. |
Clean Energy and Power | Positive | First Solar rose 4.6% and Enphase 3.7%. Grid and generation names are seen as beneficiaries of AI-driven power demand. |
Consumer and Retail | Positive | Dollar stores and retailers gained on lower oil and hopes of tariff relief on some |
Defense | Negative | Lockheed Martin fell 6.9%, Northrop Grumman 4.5% and General Dynamics 2.6% on expected oversight and scrutiny of Iran war funding. |
Oil and Gas | Negative | The energy sector fell 4.8% as crude dropped on bets the result pushes Washington |
AI Infrastructure | Negative | Hyperscalers rose Wednesday while data-center builders fell. On Thursday the selloff spread to chips, with the PHLX semiconductor index down 12%. |
Regarding banks and crypto, analysts flag more oversight of big banks and digital-asset firms.
Again, these are Wednesday's one-day moves, not a thesis, and Thursday's selloff has already scrambled some of them.
For Canada, the mood improves faster than the mechanics
Thursday's selloff was about AI, not trade, so it does not change what the election means for Canada. The election makes a Canada-US deal more plausible, but it does not make one inevitable. The tariffs on Canadian steel, autos and other goods run largely through executive action, but I would argue that even a Democratic Congress won’t necessarily stop Trump from pursuing them. What has changed is the politics. Tariffs on Canadian goods became a liability for Republicans in border states, and six Republicans joined Democrats earlier this year in backing a bill against the Canada tariffs. With Democrats set to hold the investigative gavels in January, the White House has more reason to want a quiet win on trade in my opinion.
The structural risk, however, remains. At the July review, the US declined to extend CUSMA beyond 2036. Oil is the other channel, and it is volatile: Brent fell nearly 9% on Wednesday, then bounced back toward US$97 to US$98 on Thursday. Lower crude helps Canadian consumers and inflation, but it trims revenue for an energy exporter. That tension runs straight through
Thursday’s federal budget.
Thursday's federal budget projects a $62.3 billion deficit for this fiscal year, about $3 billion below April's projection, alongside
$142.1 billion of new spending and tax measures over five years. The government says the operating budget will balance by next year but, overall, there is no path to balance, with deficits above $50 billion in each of the next four years. Federal debt stays near 40% of GDP, and the measures include a further 50% top-up to the GST rebate early next year.
The improvement is oil-assisted. Revenues are running well above what was expected and the government chose to spend the windfall rather than save it. The budget's own scenarios show what is at stake. If the Middle East conflict persists, higher inflation and tighter financial conditions push next year's deficit as high as $66.1 billion, while a stronger business investment cycle trims it to $61.4 billion. So, peace is not a simple threat to Ottawa's finances: it trims the oil windfall but eases inflation and borrowing costs.
Debt service is the quiet story. Public debt charges are projected to reach nearly 13% of government spending by 2031. Conservative Leader Pierre Poilievre called it "Carney's Costly Credit Card budget" and pointed to interest costs rising to $85.5 billion in 2030-31. Finance Minister François-Philippe Champagne counters that Canada has among the lowest deficit-to-GDP ratios and 10-year yields in the G7, and that the cost remains manageable.
That is the link back to our US story. The budget says Canadians, not the bond market, will determine Ottawa's choices, a confident line in a year when the US 10-year yield topped 5.30% last month. In a world where global investors are looking for alternative options to US debt, I would argue that Canada is somewhat better positioned to deal with a higher for longer world than other heavily indebted countries. That doesn’t mean it’s immune. Ottawa's room to run these deficits still depends on global bond markets staying orderly, and a hawkish Fed, an oil shock and an AI-driven risk-off do not guarantee that. The mix also complicates the Bank of Canada's job. It hiked rates last week for the first time in more than three years and flagged
considerable uncertainty from trade tensions. As we noted last week, fiscal support and monetary tightening pulling in different directions is a delicate balance.
No need for a course correction - yet
I sincerely hope this initial spike in market volatility and this annoying cough both fade away. I will repeat something that I have said several times this year: Fundamentals will dictate the direction of equities and bonds in 2027 more so than the policy environment and that still holds. If geopolitical and trade tensions dissipate and inflation falls, then there is a decent chance that economic conditions can remain supportive for both markets. Room for error, however, has also diminished. Some will argue that the whole AI “bubble” needed a pin in it in order for us to move to the next phase of the investment thesis. Perhaps, and we can look back to the US railroad bubble of the 1870s and the dot-com era of the late 1990s as examples of technologies that eventually become part of everyday life. The question is whether this week’s election outcome has put us on a path towards a repeat of history or a much-needed cooling off effect to prevent it.
On behalf of the Pyle Wealth Advisory team, have a wonderful weekend.
Andrew Pyle
Related posts
Andrew Pyle
October 16, 2026
Lost at C
AI may be taking the lead guitar part, but consumer spending is still carrying the song—and its footing looks increasingly shaky.
Read moreAndrew Pyle
August 21, 2026
Who’s Actually in Tune with AI?
A guitar riff, a trade rant, and an AI reality check: the world is not adopting AI in harmony, and that mismatch may matter for markets.
Read more