




Andrew Pyle
July 19, 2024


Tariffs, inflation and bears - Oh my
While we are still months away from the U.S. election, the events of the past few weeks have tilted the odds so much in favour of the former president returning to the White House, that investors have to seriously consider that some not so market-friendly policies might re-emerge in 2025. Those would include the U.S. position on global trade and how it steers its own fiscal ship. Prior to this week, the S&P500 had gone 52 straight sessions without a one-day loss of 1% or more and that string was broken by exactly 1:10pm on the 17th. The correction that took place on Wednesday was actually a reaction to the threat of even stricter tariffs being imposed on chip exports to China – something that Ally wrote about on June 21st (click here to read her commentary). Coming during the RNC convention and calls from the podium for increased tariffs in general, the timing couldn’t be worse.
Prior to the 2016 election, economists and market participants didn’t fully grasp the extent to which the incoming administration would pursue a restrictive trade policy. In 2018, the U.S. had essentially declared tariff war on China, but also on other countries. In January of that year, Washington imposed tariffs on Chinese-made solar panels and then expanded this to steel and aluminum from China and other countries in the region. By June, steel and aluminum tariffs covered imports from Canada, the EU and Mexico, with even broader restrictions on Chinese products.

From just before the implementation of the North American Free Trade Agreement (NAFTA), U.S. tariffs on imports followed a downward trajectory. The above chart shows the trade-weighted average tariff rate for the U.S., as compiled by the World Bank. In 2007, it had fallen to around 1.6% and remained above this level for the next decade. Following Trump’s tariff barrage, the average spiked to almost 14% in 2019. So far, we have not yet seen a fully constituted campaign platform from the Trump camp, however there have been indications that he favours an across-the-board tariff of 60% on Chinese imports. If implemented, this would almost certainly see China retaliate, causing even more uncertainty for global supply chains.
The main concern of entering another period of tariff wars is the inflationary impact this could have. Just as we are starting to see inflation pressures ease, paving the way for a relaxation of interest rates, a sudden resurgence in inflation could put an early end to trend. In less than two weeks, the Federal Reserve will deliberate on whether to cut rates or to put that action off until September and later in the year. Assuming that cooler economic activity prevails into 2025, it’s possible we could see additional rate cuts before any major policy changes are made via Trump 2.0. It took a year last time around before the tariff wars begun. This time, it might happen sooner.
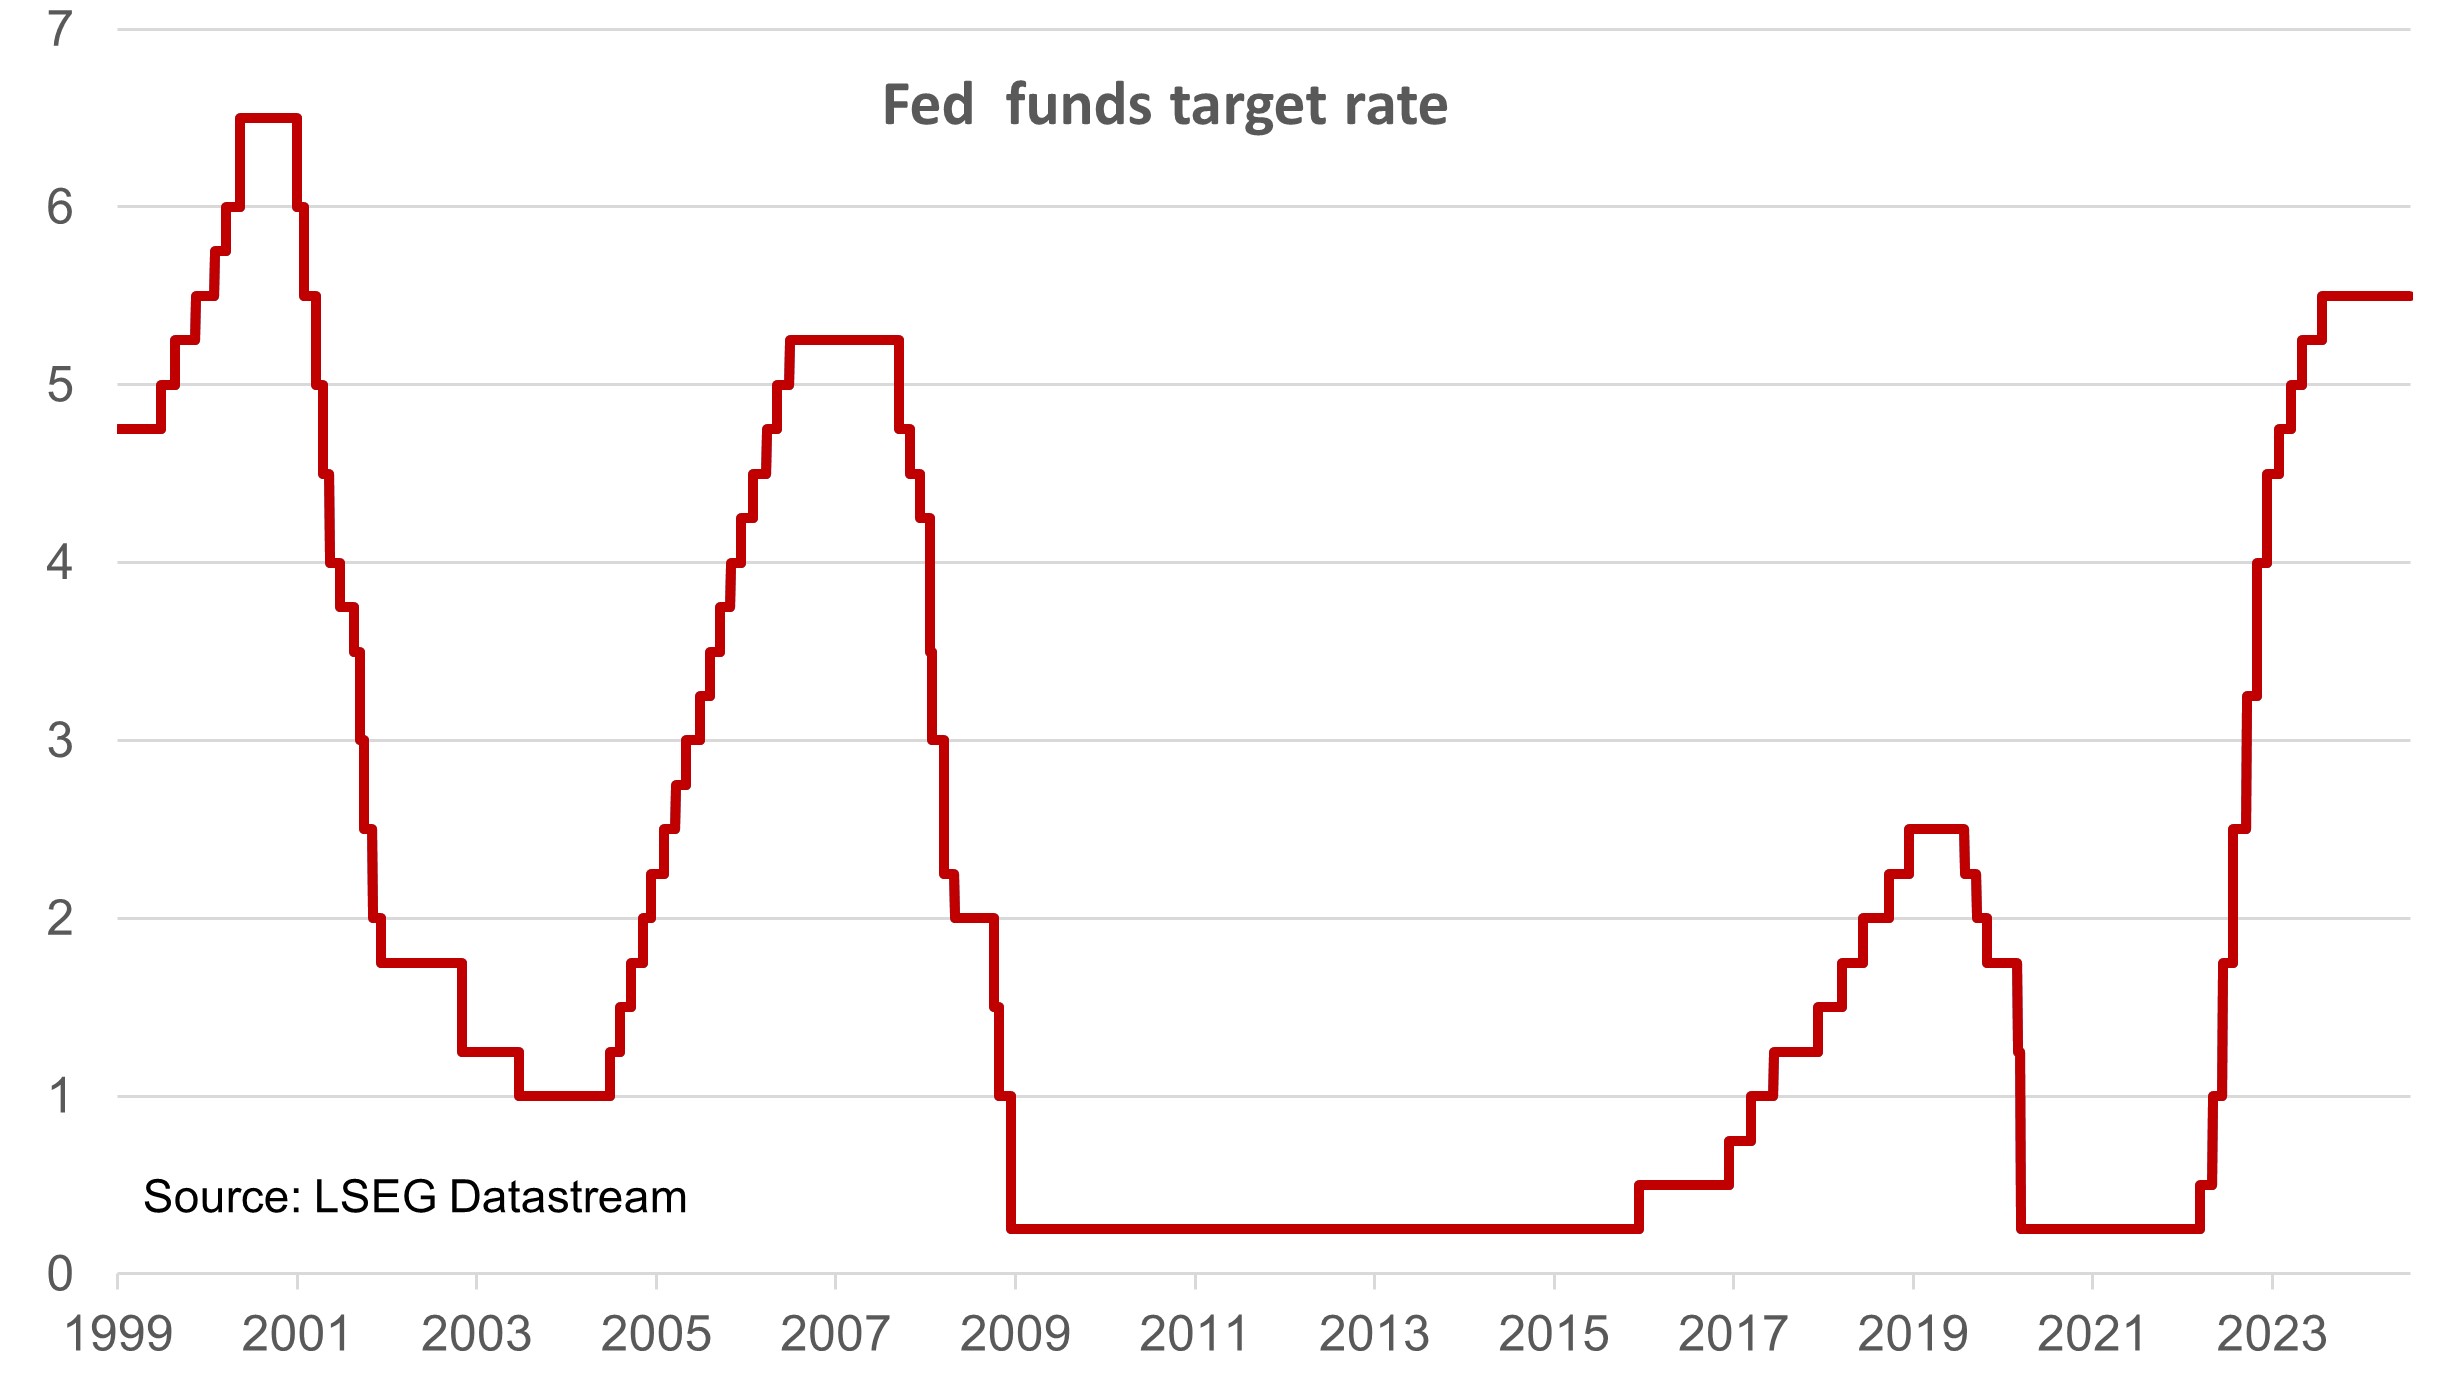
If so, then the inflationary effects of those policies could start to show up by the end of 2025, potentially limiting the extent of further rate cuts. As the above chart shows, the Federal Reserve started to tighten policy by the beginning of the last Trump administration. As rates moved higher, global economic conditions softened, and weakness spread even further as tariffs were ratcheted up. Ultimately, the U.S. economy began to buckle, and the Fed had to step in and cut rates. Given that we are still waiting for the first rate reduction this cycle, the pressure on growth continues to accumulate and if rates do not return to where we think the “natural rate” is (say 3%), then the impact of tariffs could again tip the economy into recession.
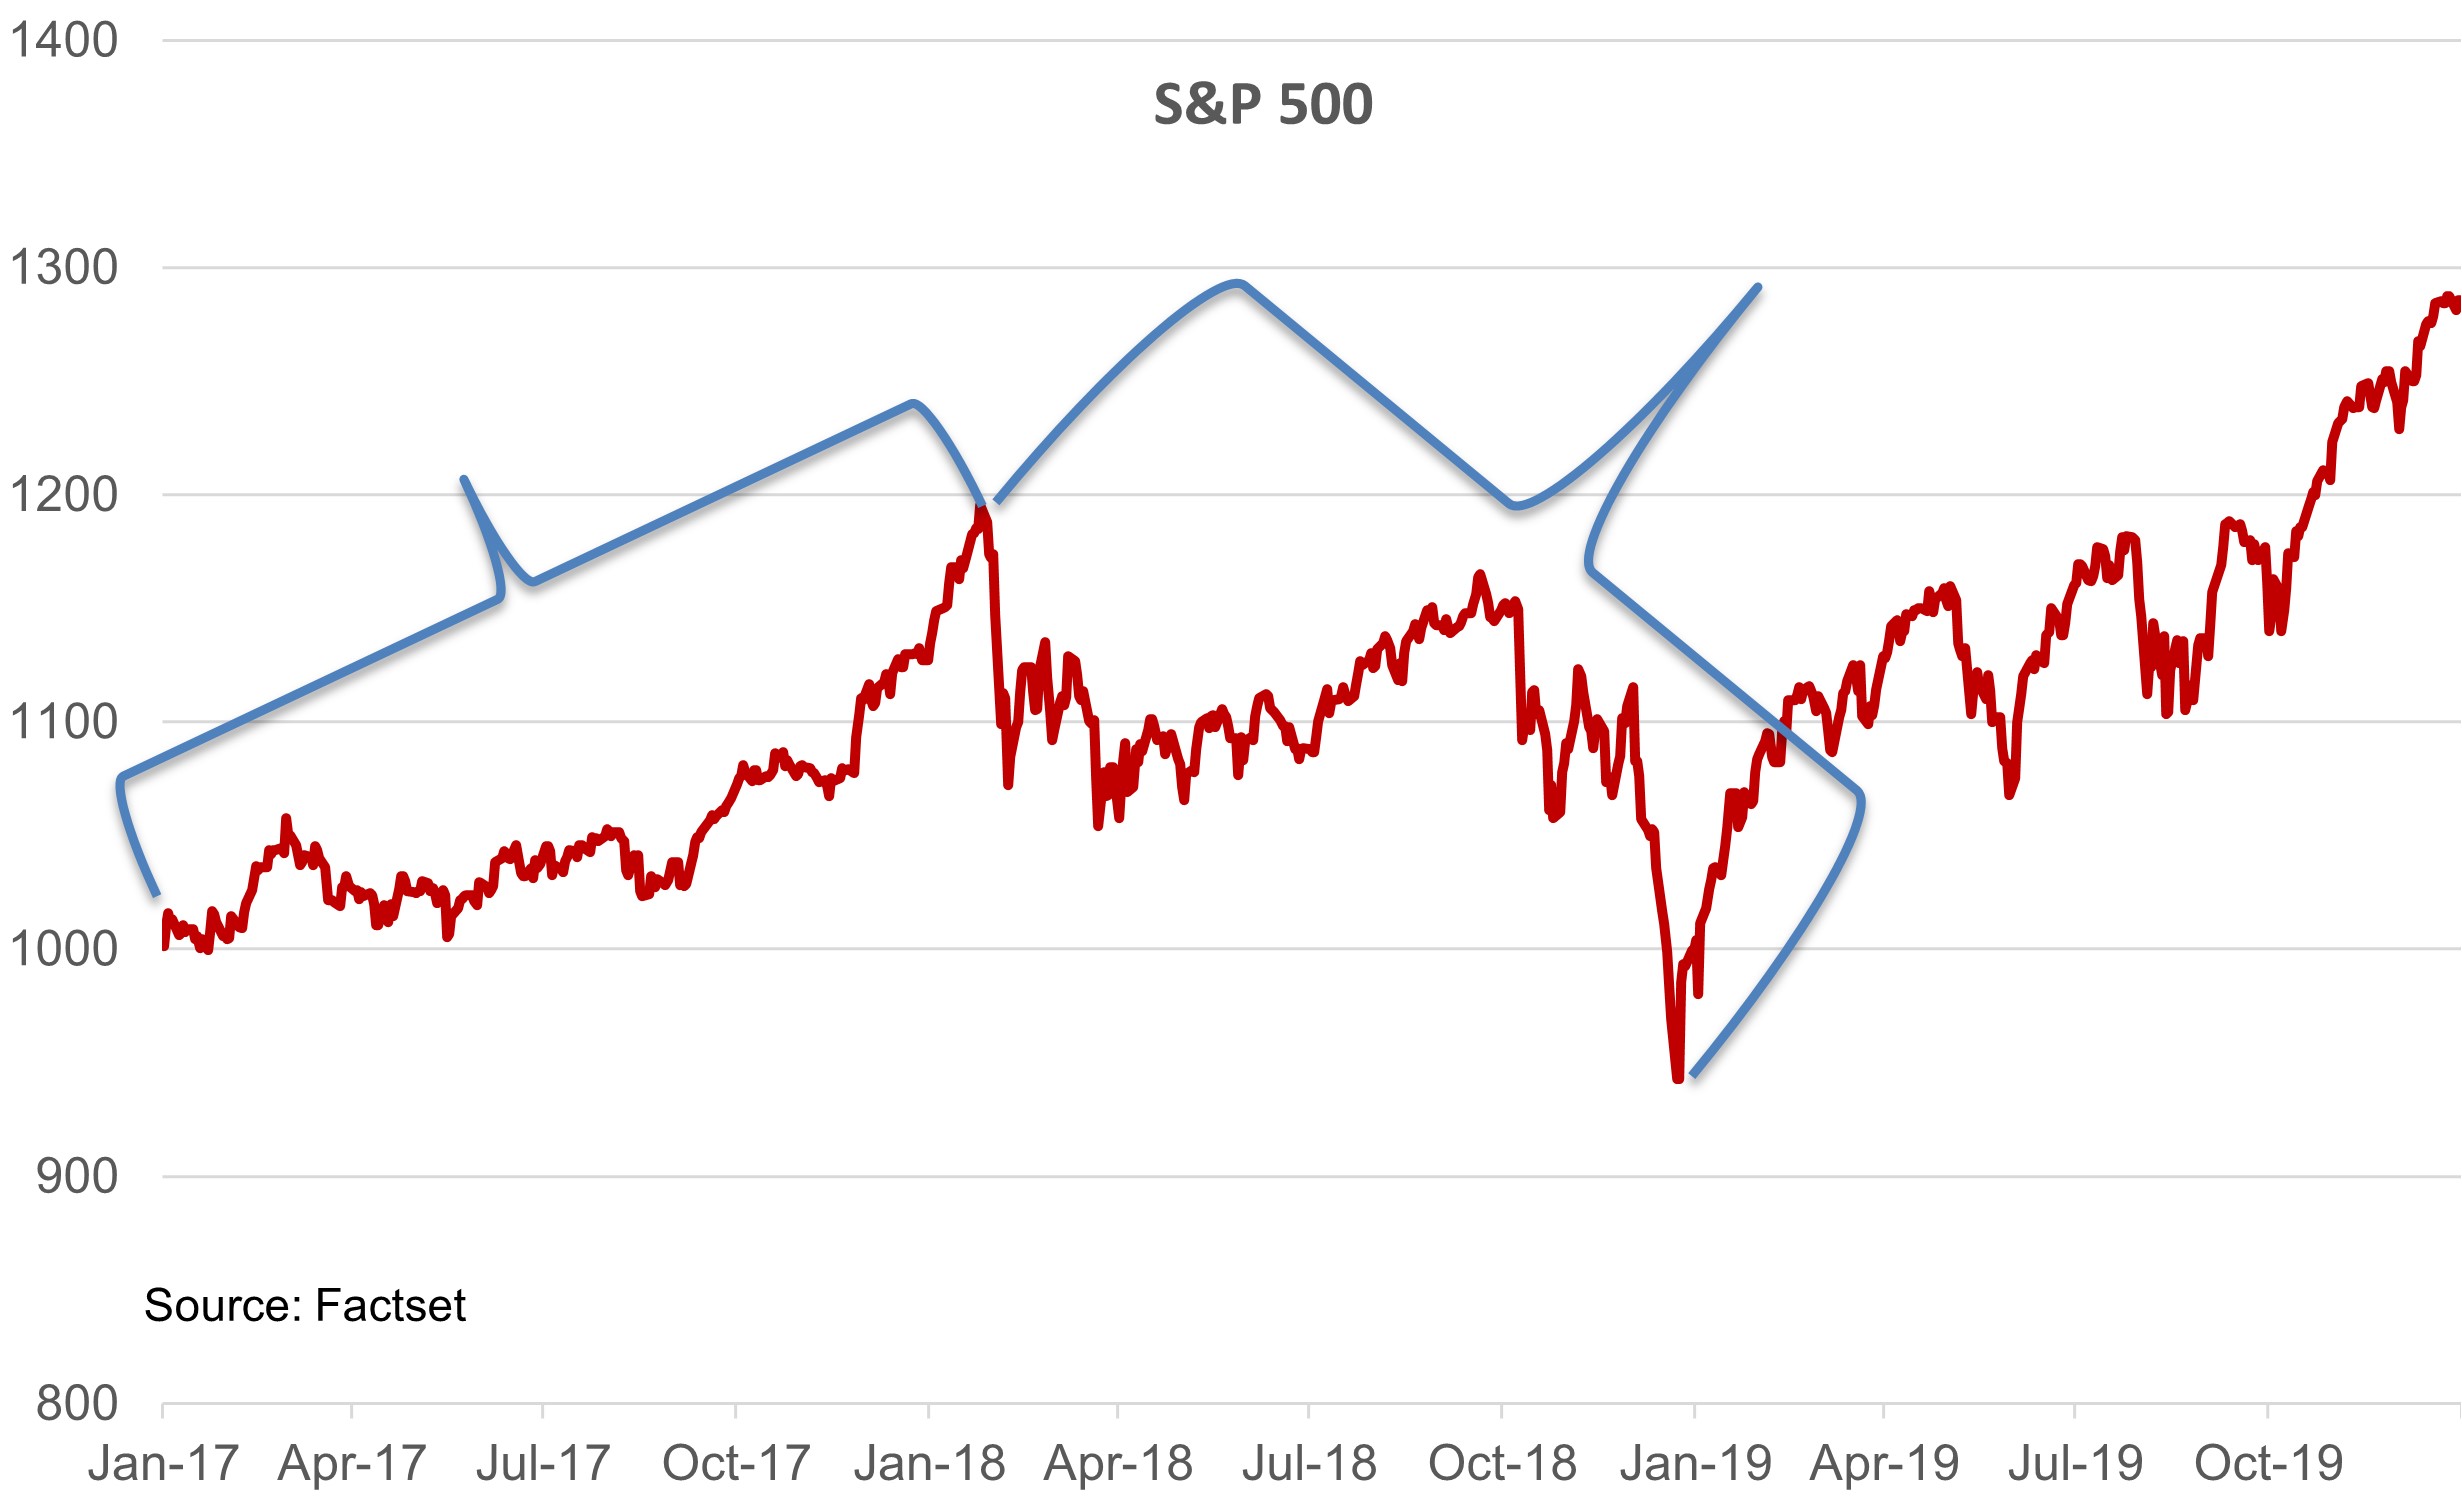
The timing of any imposition of tariffs and potential delay in monetary easing (or resumptive tightening) will be critical for not only the economy, but also the equity market. The first two years of the first Trump administration were a dichotomy. Typical year-one euphoria in 2017, coupled with aggressive tax cuts and deregulation, led the S&P500 to a 19% gain in just over 12 months as the chart above shows. By Christmas Eve of 2018, the index had lost more than 21% and returned to the levels it was trading at around the time of the 2016 election. The eventual pivot in Fed policy in 2019 helped reinforce a recovery.
Again, under the assumption of a second Trump term, it is reasonable to assume we follow a similar pattern, though more compressed. The honeymoon phase takes place in a shorter time period, followed by the economic reality created by trade frictions, followed by an accommodative response from the Fed. The one snag in this comparison is fiscal policy.
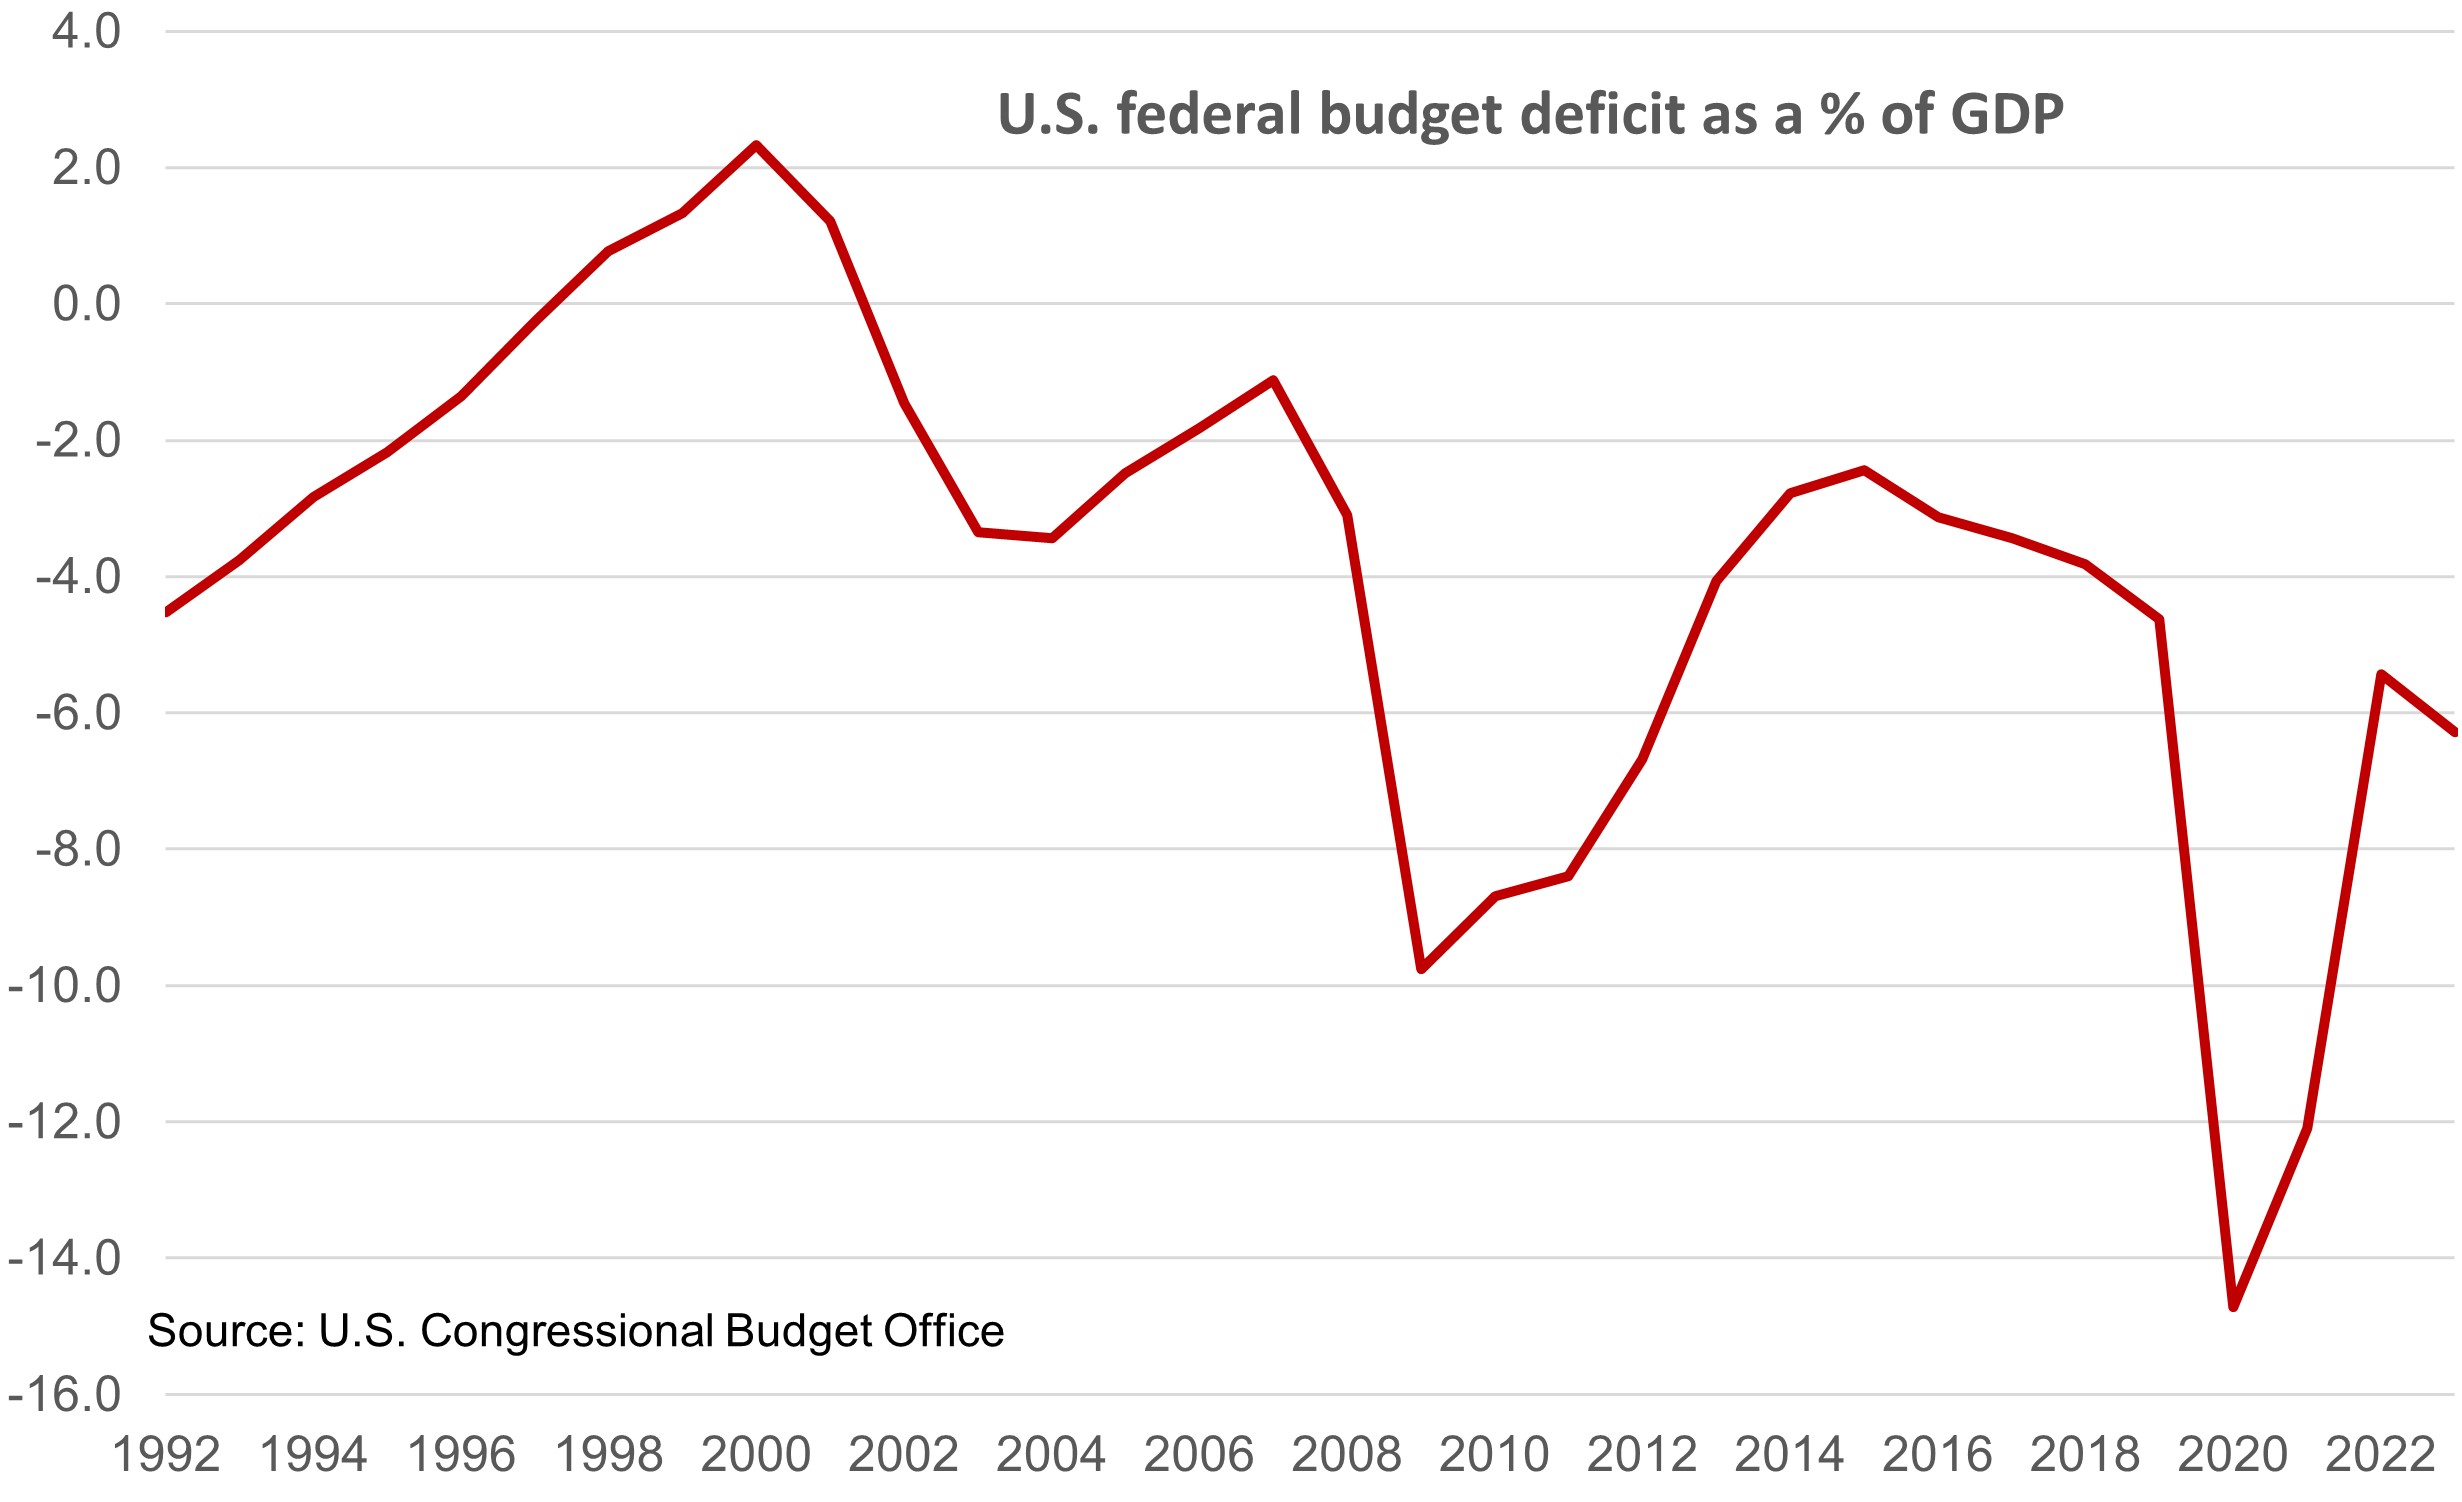
Back in 2016, the U.S. federal deficit was 3.1% of the size of the economy as seen in the chart above. This was an uptick from the prior year, which had seen six straight years of decline after the spike in deficit spending brought on by the financial crisis. By 2019, the deficit had climbed to 4.6% of GDP which (outside of the financial crisis) was the largest since 1986. Still, most economists would agree that the 2016 deficit was more manageable than where we are today at north of 6%. If tax cuts were to be extended next year (worth close to $2 trillion) then it is hard to see how the deficit gets reined in.
The reason why this is important is that while the Federal Reserve is going to be busy tackling the potential cross currents of tariff-induced economic malaise and higher inflation, the bond market (and credit rating agencies for that matter) might have to have to factor in the possibility of fiscal decay. That, in turn, could cause longer-term bond yields to rise which creates two problems. One is that mortgage rates might rise and choke off whatever housing recovery is in place. Second, owners of debt could experience another portfolio jolt, only a few years after licking the wounds of 2022.
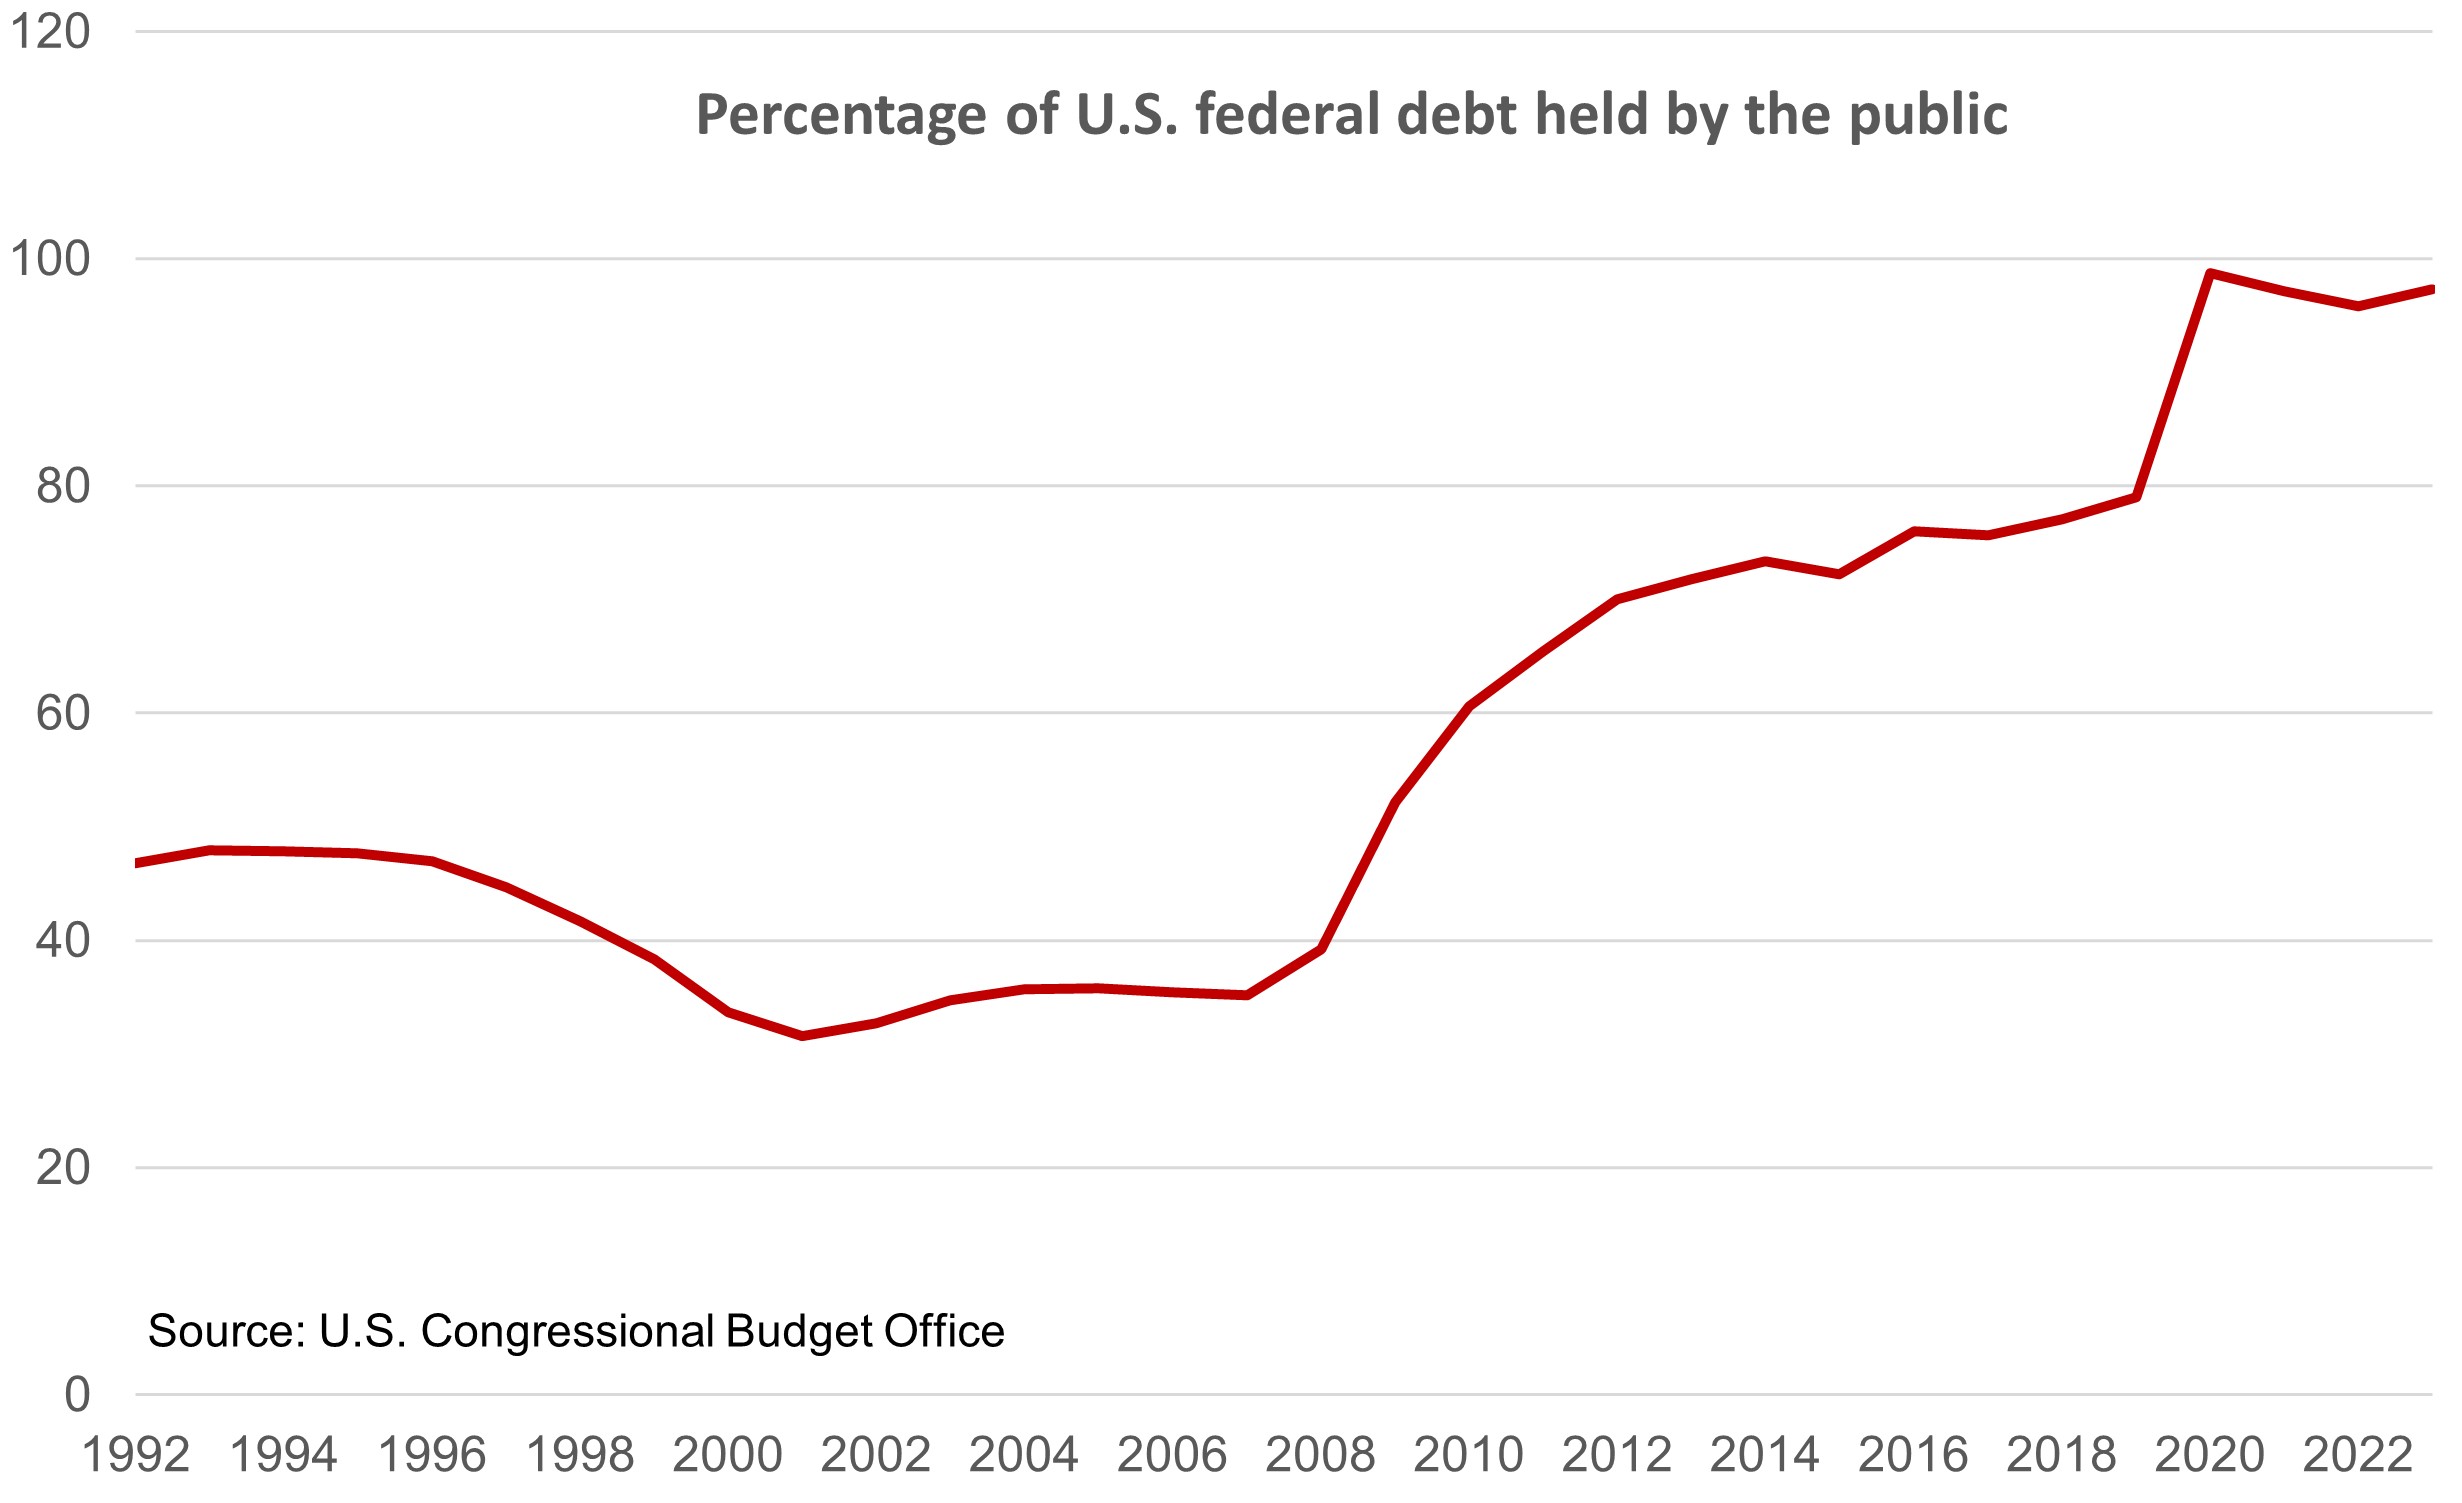
As the above chart shows, the percentage of U.S. federal debt held by the public stood at 97.3% at the end of last year. That is under the modern historical peak of 98.7% reached in the pandemic year, but not far off. In just over 20 years it has climbed by 20 percentage points. We have not seen this number breach 100%, but if you combine a weaker economy and wider deficit, then this is possible.
Okay, let’s take a breath and remind ourselves that there are still more than 100 days before the presidential election and much can change between now and then. This week saw jitters emerge in risk assets, but keep in mind that valuations weren’t exactly cheap going into last weekend either. There is no compelling reason, in our opinion, that would suggest making dramatic changes to individual portfolios. However, as I mentioned last week, the shorter the runway becomes going into the election, individuals may take a more defensive approach if the concerns of this past week start to look more like premonition.
On behalf of the Pyle Wealth Advisory team, have a wonderful weekend.
Andrew Pyle
CIBC Private Wealth consists of services provided by CIBC and certain of its subsidiaries, including CIBC Wood Gundy, a division of CIBC World Markets Inc. The CIBC logo and “CIBC Private Wealth” are trademarks of CIBC, used under license. “Wood Gundy” is a registered trademark of CIBC World Markets Inc.
This information, including any opinion, is based on various sources believed to be reliable, but its accuracy cannot be guaranteed and is subject to change. CIBC and CIBC World Markets Inc., their affiliates, directors, officers and employees may buy, sell, or hold a position in securities of a company mentioned herein, its affiliates or subsidiaries, and may also perform financial advisory services, investment banking or other services for, or have lending or other credit relationships with the same. CIBC World Markets Inc. and its representatives will receive sales commissions and/or a spread between bid and ask prices if you purchase, sell or hold the securities referred to above. © CIBC World Markets Inc. 2024.
Clients are advised to seek advice regarding their particular circumstances from their personal tax and legal advisors.
The contents of this communication are for informational purposes only and are not being provided in the context of an offering of any security, sector or financial instrument, and is not a recommendation or solicitation to buy, hold or sell any security.
If you are currently a CIBC Wood Gundy client, please contact your Investment Advisor.
Related posts
Andrew Pyle
October 30, 2026
The Road Less Hiked
The road less hiked made all the difference this week, with the BoC opting to move while the Fed preferred to linger at the fork.
Read moreAndrew Pyle
October 23, 2026
Death and Taxes: Agonizing Over the Wrong Bill
The bill most families worry about after death is often not the one that costs the most. Good planning starts with knowing the difference.
Read more